ACCORDING to the Malaysian Investment Development Authority (MIDA), Malaysia is the leading exporter of wooden furniture globally. Malaysia exported about 80% of its furniture production and is ranked among the top 10 largest exporters of furniture in the world.
The Malaysian furniture industry has contributed about 0.3% to 0.4 % to the Malaysian gross domestic product (GDP). As such, it is not surprising that there are more than two dozen furniture companies listed on Bursa Malaysia.
Together, they accounted for about one-third of the total Malaysian furniture production.
The COVID-19 pandemic has affected most of the economies around the world in 2020 and 2021. As such, you may think that the results of the furniture companies under Bursa Malaysia would be disappointing, but you are in for a surprise.
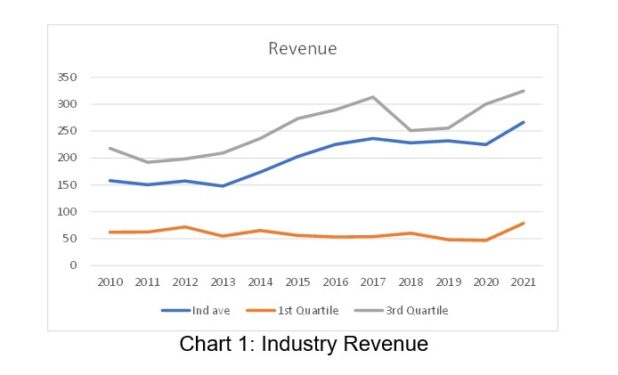
Chart 1 shows revenue of 21 furniture companies under Bursa Malaysia (hereinafter referred to as “industry”) for the past 11 years. There was no significant revenue decline in the 2021 and 2020 compared to 2019. There was even growth in 2021.
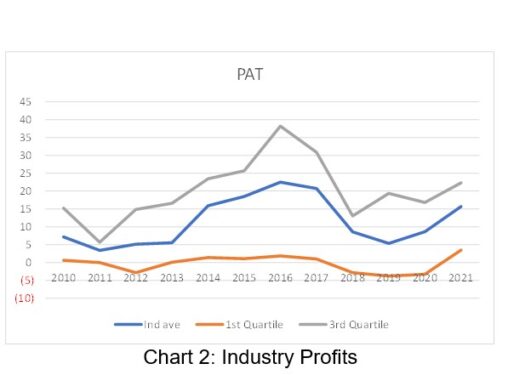
The industry showed a similar pattern in terms of profits. It seemed resilient to the impact of COVID-19.
The revenue and profit charts showed that relative to 2010, the industry had grown over the past decade.
- The total revenue for these 21 companies grew at 4.9 % compound annual growth rate (CAGR) from 2010 to 2021; and
- The industry average net profit grew at a CAGR of 7.4 % from 2010 to 2020. The net profit peaked in 2016 and had not been able to match the peak value since then. The past decade industry average net profit showed a “humped” profile.
Don’t be surprised to see that the returns in 2020 and 2021 were much better than that in 2019. However, when you looked at the return of equity (ROE) over the past decade, you can see that the ROE in 2021 at 7.6 % was lower than the ROE of 7.9 % in 2010.
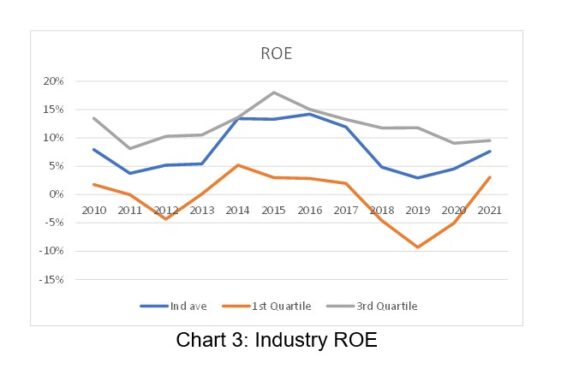
The declining returns given the positive growth in net profit were because the total equity grew at a faster rate than the growth in net profit. Note that the industry average ROE has the similar “hump” pattern as that for the industry average net profit.
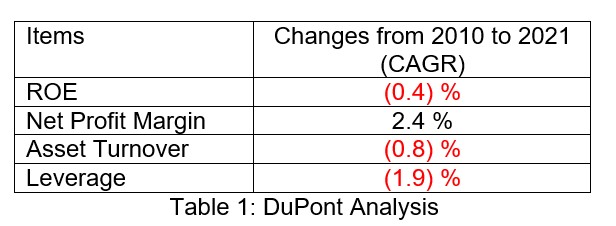
I also carried out a DuPont analysis of the ROE to get an understanding of what drove the decline. As can be seen from Table 1, the declining asset turnover and leverage more than offset the growth in net profit margin.
But if you look at the profile of the DuPont components, you can see that the changes in net profit margin seemed to mirror the changes in ROE.
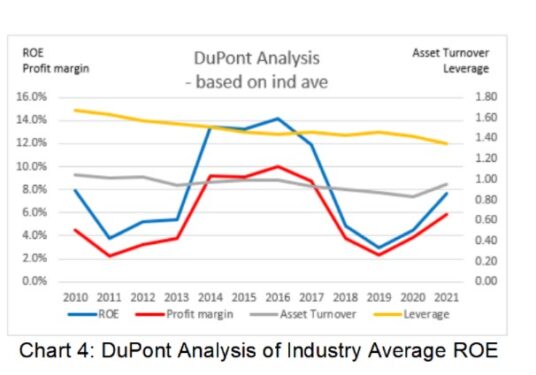
The “hump”
To get a better understanding for the “hump”, I carried out a detailed analysis of seven companies that accounted for 80% of the revenue in 2014/2015. The analysis showed two common reasons for the spike in net profit in 2014/2015 compared to the previous year.
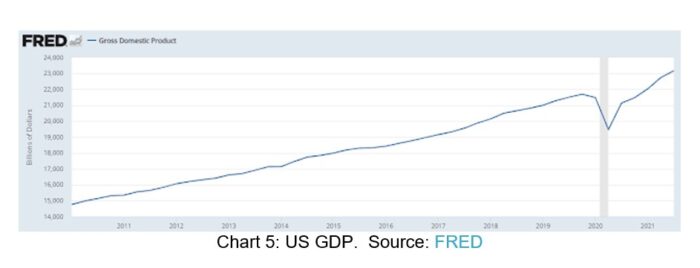
- The growing economies of the importing countries: A good example of this is the US which accounted for 60% of the total Malaysian exports in 2020. As can be seen from Chart 5, the US had been experiencing a steady growth in GDP. The only hiccup was in 2020 due to COVID-19.
- A jump in the exchange rate as shown in the forex chart: The exchange rate increased from about RM3.25/US$1 in 2012/2013 to about RM4.25/US$1 in 2016. This is about a 30% increase.
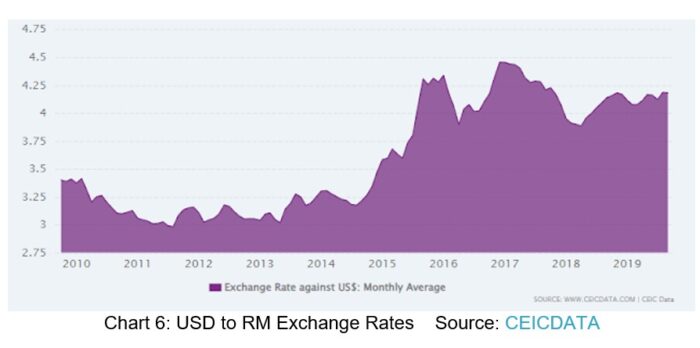
Forex accounted for a big part of the jump in profits in 2015/2016. You can see that the exchange rate remained above RM4/US$1 from 2016 onwards.
Back in 2018, the reasons for the dip in ROE were lower demand and higher operating costs. The jump in profits in 2014/2015 appeared to be a one-off event. Further profit growth for the sector moving forward from 2021 would have to depend on demand growth. The sector also has to resolve the various operating issues.
What does this mean if you are an investor in the stock market?
- The “hump” is from the confluence of demand and forex factors. It would be very challenging for the industry to regain the past decade peak performance.
- For investment opportunities, look for companies whose performance did not follow the “humped” pattern. In other words, look for companies whose performance continued to improve after the 2014/2015 spike. Are there such companies? I found three. – Jan 14, 2022
Datuk Eu Hong Chew was on the board of I-Bhd from 1999 till 2020. As Group CEO, he led its transformation from a digital appliance manufacturer into the developer of i-City, the Selangor Golden Triangle. On Jan 1, 2022, I-Bhd again appointed him as non-independent non-executive director and member of the company’s audit, nomination and risk management committees.
In this article, the “industry” refers to 21 furniture companies under Bursa Malaysia which had financials from 2020 to 2021. Note that for many of them, the 2021 figures were the last 12 months (LTM) values. The data for this article was extracted from “Which are the better stocks in Bursa Malaysia furniture sector?” which appears on i4value.asia. Refer to the article for more analysis.
The views expressed are solely of the author and do not necessarily reflect those of Focus Malaysia.


