IT is commonly accepted that there is a link between the construction sector and economic growth of a country. There were 52 companies in the construction sector as of January 2022.
However, only 40 of them had readily available financial data from 2010 to 2021. As such, whenever I mentioned about sector or industry, I am referring to the performance of these 40 companies.
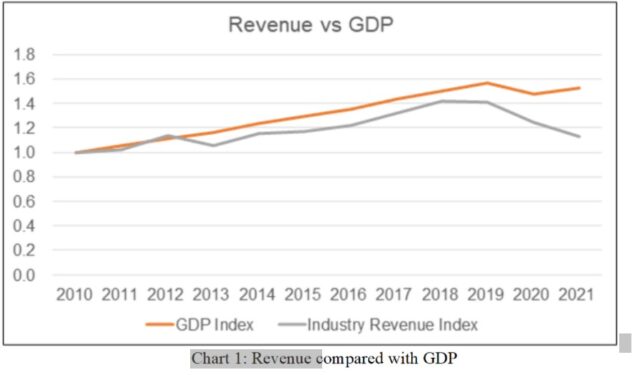
Chart 1 compared the Malaysian gross domestic product (GDP) and the revenue of the companies under the Bursa Malaysia construction sector.
During the early part of the past decade, the industry average revenue seemed to track Malaysia’s GDP growth. COVID-19 seemed to have changed the picture.
The industry revenue declined in 2020 due to the pandemic measures along the same lines as the economy. While the economy was projected to turnaround in 2021/2022, the construction sector performance got worse. Note that 2021 industry revenue was based on the September last 12 months (LTM) revenue.
From 2010 to 2021, the industry mean revenue grew at compound annual growth rate (CAGR) of 1.1%. In comparison, the Malaysian economy grew at 3.9% CAGR during the same period.
But the construction sector overall growth rate does not tell the full story. From 2010 to 2019, the industry mean revenue grew at 3.9% CAGR. It was the pandemic measures that cause the drastic decline.
From 2019 to 2021, the industry mean revenue contracted at a compounded rate of 10.5% per annum.
The sector had a very challenging performance over the past 12 years.
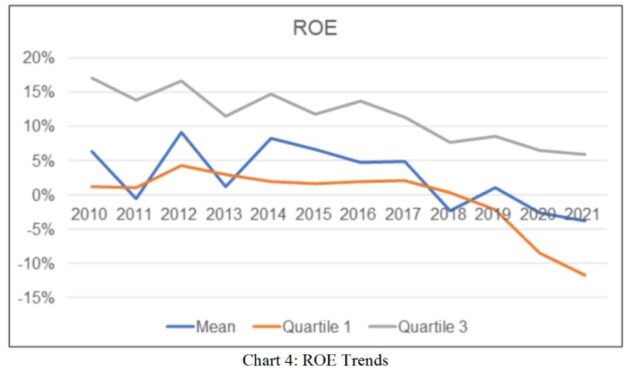
- The sector mean profit after tax (PAT) declined at a compounded 3.8% per annum. Not surprisingly, the sector return on equity (ROE) had been declining over the past 12 years. This decline began pre-COVID-19.
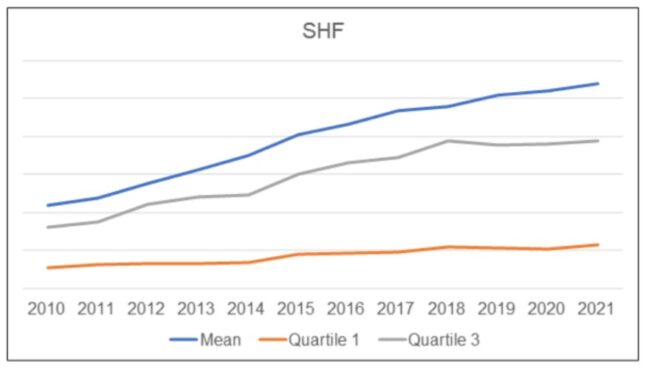
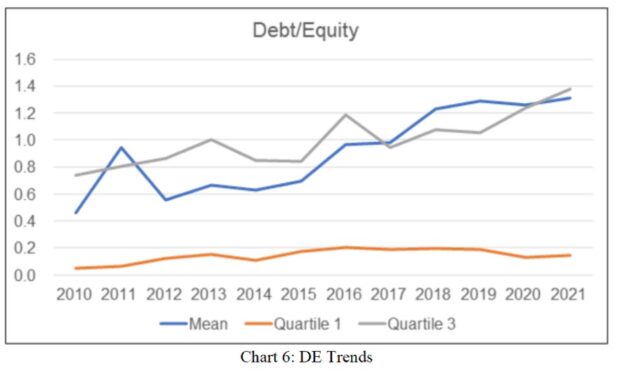
- The sector’s debt grew at a faster rate than the sector shareholders’ fund (SHF) so that the sector average debt equity ratio in 2021/2020 was higher than that in 2010.
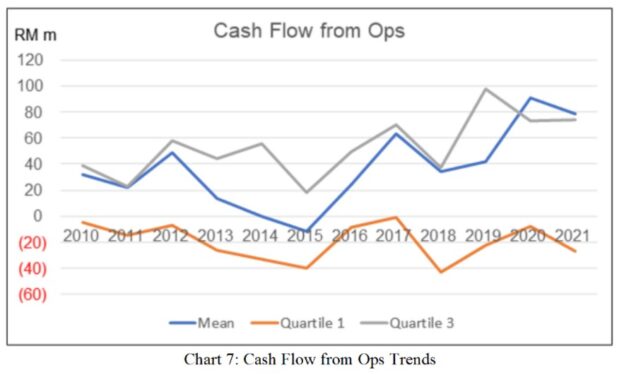
- The silver lining was that the mean cash from operations in 2021 was higher than that for 2010. The cash flow trends seemed to be positive compared to the PAT trends.
Details of the sector performance are presented in the following sections:
Revenue
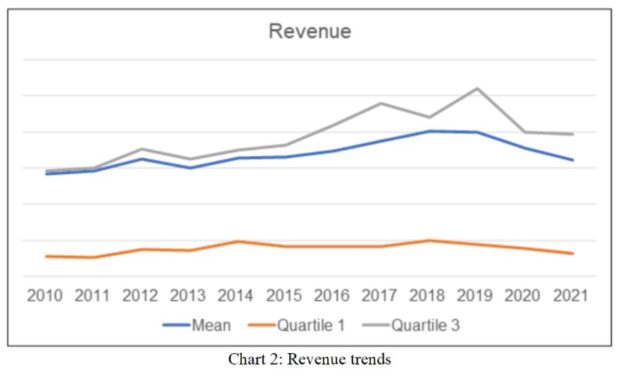
The other unusual characteristics of the industry can be seen from Chart 2. In many sectors, the mean values would lie somewhere in the middle of the interquartile ranges. But in the case of the construction sector, the mean is very near the third quartile values. It is skewed in this manner because of the relatively large revenues of a few big companies.
PAT
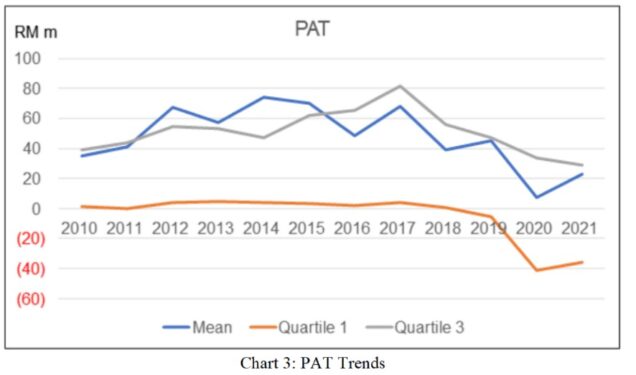
The net income for the sector was very volatile as illustrated by Chart 3. I had earlier mentioned the unusual characteristic of the mean being close to the third quartile. In the case of PAT, for the first half of the decade, the mean PAT was above the third quartile. The profits of the few large companies had very significant impact on the industry mean profits.
The sector mean PAT had been declining since 2015. This decline started long before COVID-19 and 2020 made it worst. Although 2021 was better than 2020, the industry mean PAT in 2021 was lower than that in 2010.
We see the same trends for the first and third quartiles. Chart 3 showed that in 2020 and 2021, about one-quarter of the panel was not profitable.
Looking at the PAT of individual companies:
- There were 13 companies that were profitable every year from 2010 to 2021.
- There were 11 companies that had cumulative losses from 2010 to 2021. This meant that their equity actually shrank from 2010 to 2021.
If nothing else, it demonstrated that this was a tough sector to make money.
Returns
Because of the declining PAT, the ROE was also declining. In the first half of the decade, the sector mean ROE for many years can be considered to be comparable to that of 2010. But thereafter, it began to decline, hence by 2019 (before the pandemic), it was already lower than that in 2010.
Of course, the pandemic caused it to go into negative territory in 2020 and 2021.
A DuPont analysis showed that the decline in the ROE was due to the decline in the profit margin and asset turnover.
Capital structure
The sector mean equity grew at 8.6% CAGR from 2010 to 2021. Given this growth together with the declining PAT, you should not be surprised to find that the ROE had been declining.
You will notice that the mean equity was higher than the third quartile equity. This was because there were a few very large companies that skewed the computation of the mean.
Chart 6 showed the debt equity profile of the sector.
- 60% of the panel had a higher debt equity in 2021 compared to their respective debt equity in 2010.
- The mean debt equity in 2021 was 1.3 compared to the mean debt equity of 0.9 in 2010. Given the growth in shareholders’ fund, I would interpret this as the sector debt increasing faster than the sector’s shareholders’ fund.
Cash from operations
The cash from operations had a more favourable picture compared to PAT. The mean cash from operations in 2021 was higher than that for 2010. The cash flow trends seemed to be positive compared to the PAT trends.
However, it was not all rosy because one-third of the panel had negative cumulative cash flow from operations from 2010 to 2021.
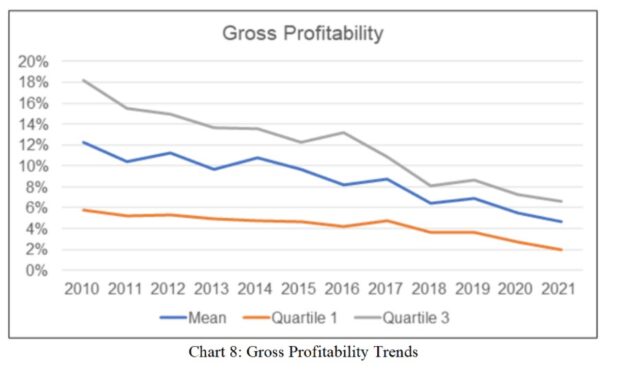
Gross profitability
Gross profitability is defined as gross profit divided by total assets.
University of Rochester professor Robert Novy-Max has done considerable research into this metric. According to him, it has roughly the same power as book-to-market in predicting the cross-section of mean returns.
You can see the declining trend from Chart 8. If you follow the Novy-Max concept, this meant that the industry returns in the immediate future is not going to be rosy.
Hunting for the right companies
What does all these mean if you are looking to invest in Bursa Malaysia construction companies?
- Look for the large companies. These are those that would fall into the upper quartile of the equity and revenue metrics.
- Look for those whose gross profitability trend is no longer declining.
But more importantly, do not expect better performance in the immediate term. – March 16, 2022
A self-taught value investor and has been investing in Bursa Malaysia and SGX companies from a value investment perspective for more than 15 years, Datuk Eu Hong Chew was re-appointed to the board of i-Bhd as non-independent non-executive director on Jan 1, 2022.
The data for this article was extracted from “Making sense of the Bursa Malaysia construction sector” on i4value.asia. Refer to the article for the methodology and further analysis.
The views expressed are solely of the author and do not necessarily reflect those of Focus Malaysia.
