IT is commonly acknowledged that the property sector is cyclical. When you look at cycles, you should differentiate between one with an underlying growth trend and one without growth.
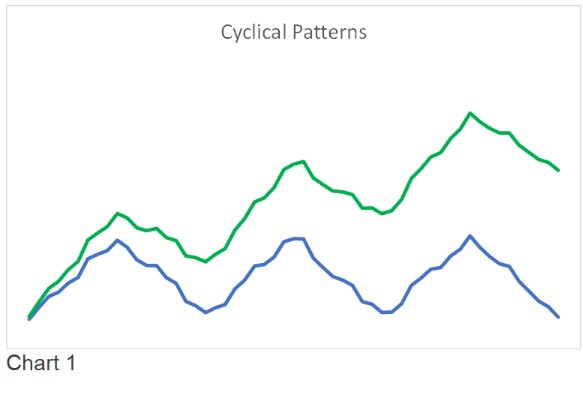
In Chart 1, the green pattern illustrates the growth trend while the blue pattern refers to one without growth. Which pattern reflects the Malaysian property cycle? This question has to be seen in the context of the metrics used to chart the pattern.
In the Malaysian context, the following data is readily available:
- House Price Index (HPI);
- Residential transactions: The data are provided in the Property Market Report published by the Valuation and Property Services Department. Data are available in the number of units and values.
- Residential Starts: The same property market reports have sections on the residential starts .
The patterns from 2002 to 2020 for each of the above metrics are shown in Chart 2. You can see that there are three different patterns.
- The HPI is cyclical growth one: Over the past 20 years, there seems to be one trough and one peak. You can see this easily by drawing a straight line from the start to the end of the HPI line.
- The Residential Starts (denoted by Starts Index in Chart 2) show two peaks: The 2020 value is lower than the 2002 value. You could argue that it is currently in the downtrend part of the cycle and there would be a turnaround in the not-too-distant future.
- The residential transactions peaked in 2011/2012 and we are currently in the downtrend part.
The residential starts and the residential transactions do not exhibit any long-term growth. At the same time, the three different metrics had different peaks and troughs.
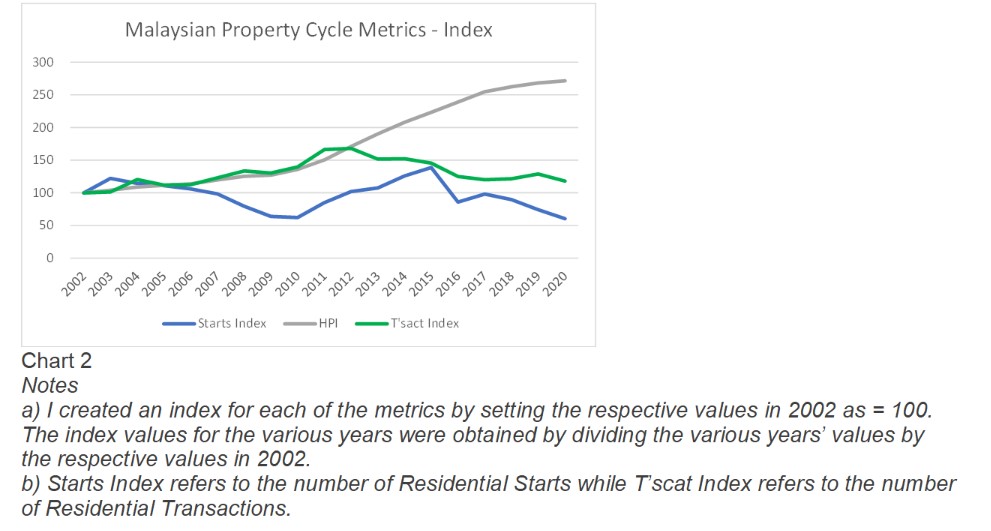
The data suggests that prices seem to be trending up over the past 20 years. But the number of transactions or even the residential starts does not show any growth.
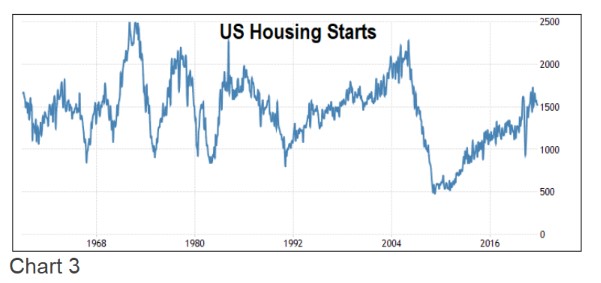
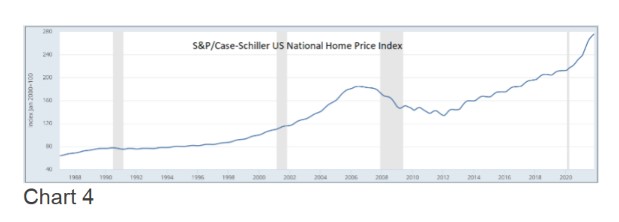
This is not a Malaysian feature. We see similar patterns in the US. Charts 3 and 4 are the housing starts and HPI for the US over the past 70 years. It shows that the long-term average US housing starts seem to be stable. There is no cyclical growth pattern. But the US housing price index shows a long-term uptrend.
Of course, these are only for 20 years of history in Malaysia. But the no-growth pattern in the number of residential transactions seems to be in line with the residential starts. It means that from a long-term perspective, the property developers build the same number of houses.
But the average house price is increasing. Does this imply that the revenue of property developers will have an uptrend?
In Chart 5, I have superimposed the average revenue for the Bursa Malaysia property companies onto the metrics in Chart 2. You can see that the property companies’ revenue has its up and down. The revenue better tracks the HPI more than the residential transactions or residential starts.
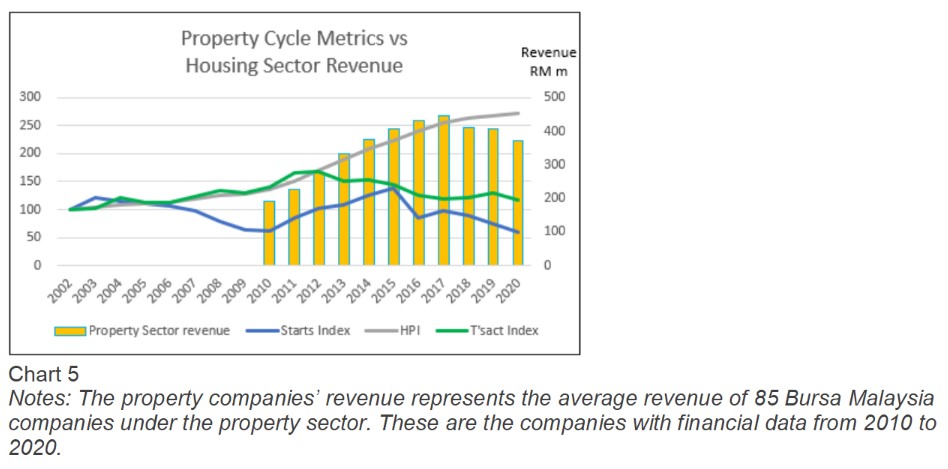
If you look at the revenue, you can see it trending up from 2010 to the peak in 2017. It then started to decline. It is a different pattern compared to those for the HPI and residential transactions.
But before we try to interpret what this meant, remember that the data were from different sampling sources. For example, the HPI is based on completed houses. Residential transactions cover those between individuals and between property developers and individuals.
Revenue covers residential and non-residential sales as well as from non-property development sources.
With these as caveats, let me offer one possible explanation for the patterns. From 2010 to 2017, the growth in prices more than offset the decline in the number of transactions. This led to increased revenue.
But from 2018 to 2020, there was a slowdown in the HPI trendline. This slowdown together with the declining number of transactions led to a decline in the revenue.
There was no long-term increase in the number of residential starts and residential transactions over the past 20 years. Given this development, does it mean that over the long-term, price increases play a big role in the changes in the revenue of property companies?
The chart patterns raise some “chicken or egg” questions.
- Are prices going up because we are not building more houses thus affecting the supply and demand picture? Or are price increases an inflationary effect?
- Does the lack of growth over the past 20 years in the residential starts mean that the market can only absorb a certain level of new houses yearly? Malaysian property companies do not come together yearly to determine the number of houses to build. Yet, the patterns suggest that “the wisdom of the crowd” has resulted in a “steady level” of residential starts but with price increases.
I will leave you with two foods for thought. For house buyers, delaying house purchases does not seem like a good idea. For property developers, the pie in the context of residential starts remains the same size. More players coming into the market would mean a smaller share of the pie for individual developers. – April 23, 2022
A self-taught value investor who has been investing in Bursa Malaysia and SGX companies from a value investment perspective for more than 15 years, Datuk Eu Hong Chew was re-appointed to the board of i-Bhd as non-independent non-executive director on Jan 1, 2022.
The data for this article was extracted from “How to identify property cycles for equity investment opportunities” on i4value.asia. Refer to the article for the methodology and further analysis.
The views expressed are solely of the author and do not necessarily reflect those of Focus Malaysia.


