


NATIONAL income distribution is one of the most important statistics for policymakers. So is the Gini inequality index, even though an imperfect measure like any single-figure summary of a distribution.
Nevertheless, when interpreted cautiously and in combination with other indicators, instead of cherry-picking facts and stretching facts too far, Gini is still instrumental in pointing to important dynamics.
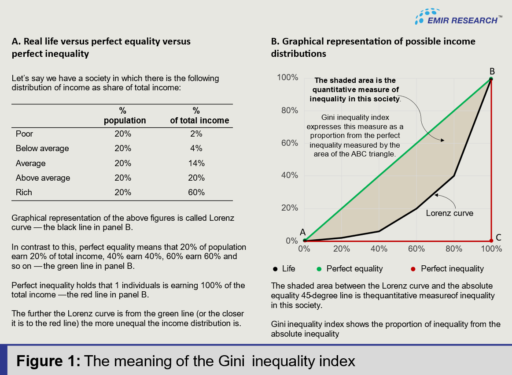
Gini inequality index measures the proportion of inequality in the society in terms of income distribution as per cent of an absolute inequality (see Figure 1). Therefore, the lower Gini readings are desired by the policymakers.
In a recently held public debate on the Sapura bailout with opposition leader Datuk Seri Anwar Ibrahim, Datuk Seri Najib Razak used the Gini inequality index data for Malaysia to acclaim the quality of his administration.
He implied that policies under his administration geared toward closing the income inequality gap were fruitful in achieving such an agenda.
However, let’s evaluate the weight of this argument constructively.
Figure 2 visualises Malaysia’s Gini inequality index historical data, as reported by the Department of Statistics Malaysia (DOSM), World Bank, and the Estimated Household Income Inequality dataset (EHII) – the popular dataset for academic empirical research.
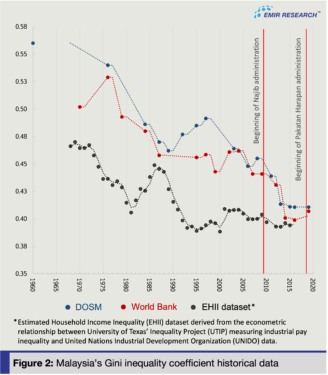
Figure 2 also demarks the period of Najib’s administration. Therefore, being fair to the data, Malaysia’s Gini inequality index, based on multiple sources, has started to flatten and even curve up a few years into Najib’s administration, pointing to some important structural changes during that same period and even earlier.
Pay attention to how, based on the EHII dataset, the Gini inequality index has started flattening and gradually rising already since the year 1995.
In trying to ascertain such behaviour of Malaysia’s Gini inequality index, the empirical work by the group of researchers led by MIT Macro Connections scientist, Dominik Hartmann is a source of valuable insights that even resulted in a creation of a popular interactive online tool (atlas.media.mit.edu).
While applying econometrics combined with newer methods from economic complexity and network science on a very large sample (150 countries over four decades), the researchers documented a strong, robust and stable inverse relationship between a country’s income inequality and its economic complexity (as proxied by the Economic Complexity Index).
The latter is the quantified breadth and depth of the country’s exports. That is to say, in sophisticated economies with well-developed industries, the majority of exports are not on either end of the value chain, such as raw materials or simple assembly of the finished products.
This relationship was found to be stable across various decades pointing to its substantial and fundamental nature.
The relationship is also stable when controlling for other macroeconomic factors that are expected to explain cross-country variations in income inequality such as GDP growth, education level, rule of law, corruption control, government effectiveness, political stability or regulatory quality.
Furthermore, the above macroeconomic factors were found to capture information about the income inequality that is already largely captured by economic complexity.
This is absolutely expected as the complexity and diversity of the home economy absolutely requires wide distribution of knowledge and knowhow (versus “know whom”) in the economy, high level of inclusiveness, strong institutions and high level of coordination between social (need based) and industrial policies (merit based).
Finally, exploring variations in the Gini inequality index and economic complexity within countries over time, the researchers established that countries experiencing an increase (decrease) in economic complexity tend to experience a decrease (increase) in income inequality afterwards.
In other words, changes in national income inequality lag the country’s industry development changes.
This helps us now to understand better what went fundamentally wrong during Najib’s administration and even a decade prior to that as Malaysia’s Gini inequality index historical data indicates (refer Figure 2 again) – what is that genie who was let out of the bottle?
The Malaysia’s Gini inequality index simply points to the fact that during that period country’s administration has failed to make Malaysia’s economy undergo necessary structural changes in vain with global industrial development to secure its industrial breadth and depth and, as a result, sustained inequality reduction.
The Malaysia’s industry got stuck in its cheap low- and semi-skilled labour-intensive mode.
Falling behind in terms of technological catchups constrains occupational choices and learning opportunities therefore negatively impacting social mobility and consecutively income distribution.
Interestingly, in the aforementioned study, Dominik Hartmann and his co-researchers specifically highlighted Malaysia as an example of an economy that successfully managed to undergo significant industrial transformation from 1963 to 2008 (Figure 3).
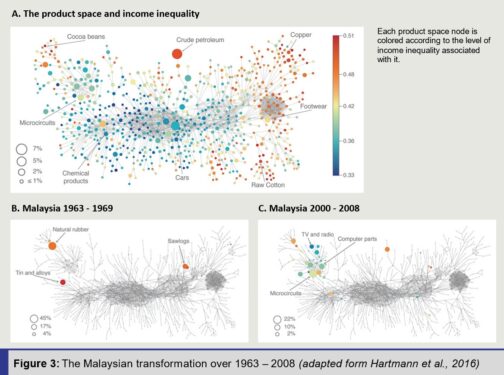
From a country heavily reliant on raw material exports Malaysia has navigated its trajectory towards becoming economy exporting – in large numbers – electronics, microcircuits and computer parts largely demanded in the world in the midst of ongoing, at that time, third industrial revolution.
However, as the Gini inequality index indicates, something went awry from the early 2000s onwards.
What does it mean for early 2000s–2010s? At that time, the world was already preparing to face a new spiral in its industrial development with the fourth industrial revolution (4IR) seriously altering the trade in the world and hugely impacting social stability.
It is well known, that each subsequent industrial revolution can be defined by the utilisation of a radically new central technology or a cluster of such technologies.
The early 2000s–2010s was exactly the period signified by the confluence of a few 4IR frontier technologies: the big data analytics era (early 2000s), the first serious artificial intelligence breakthroughs (2000–2010), distributed ledger technology take-off (early 2010s) and the birth of the internet of things (early 2010s).
However, flattening Malaysia’s Gini coefficient midway through Najib’s administration and even earlier clearly suggests that Malaysia’s governance at that time did very little to secure its future industry breadth and depth.
After all, distributing handouts to the vulnerable groups while imposing heavier taxes on the wealthier ones is important.
However, in the absence of a clear national development strategy with perfect synch of social (need-based) and industrial policies (merit-based) gearing towards holistic industry development the approach is doomed to fail to produce a sustained impact on income distribution equality and national future.
In other words, the empirical evidence around Malaysia’s Gini inequality index makes it clear one more time that it is really a high time for Malaysians to put the genie of shallow rhetoric, populism, pure narrative management back into its bottle paving the way to credible country governance, progressiveness and strict economic sense. – June 9, 2022
Dr Rais Hussin is President and CEO at EMIR Research, an independent think tank focused on strategic policy recommendations based on rigorous research.
The views expressed are solely of the author and do not necessarily reflect those of Focus Malaysia.