
WHILE the world has promoted the use of clean energy, certain sources of clean energy will be more important than others. Clean energy comes from various sources, including hydropower, wind, solar, biomass, and nuclear.
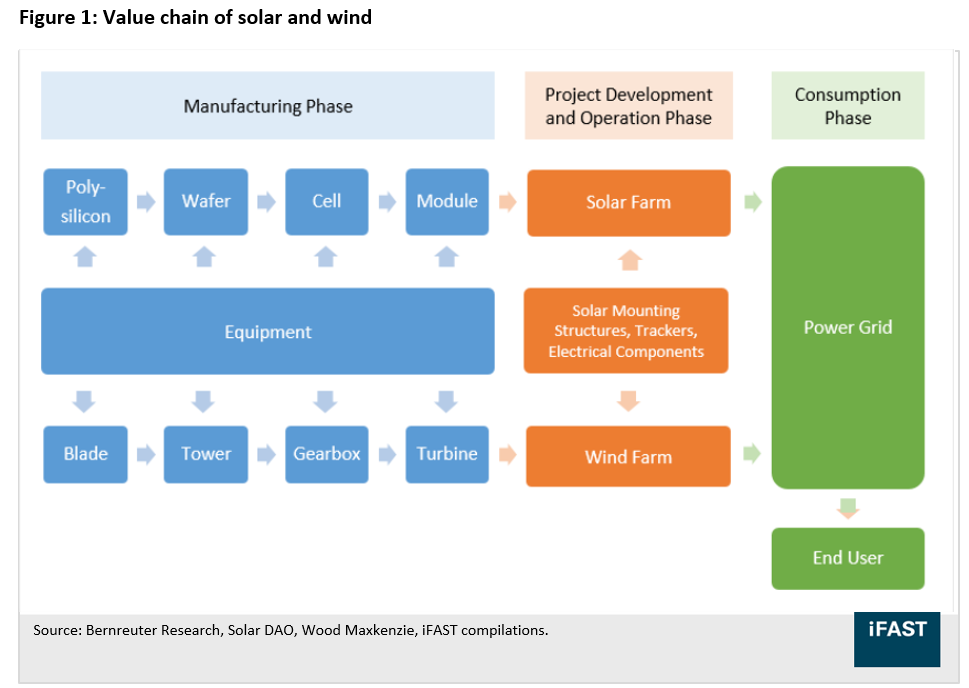
The clean energy value chain involves several activities from the manufacturing to the consumption phase. Figure 1 below illustrates the value chain of solar and wind energy – two of the most popular sources of clean energy.
Before assembling a solar module (ie. solar panel) or wind turbine, their components must first be manufactured. The components include polysilicon and wafers for solar or blades and towers for wind. They are manufactured with the help of various equipment which manufacturers purchase from equipment suppliers.
After the components are assembled to form solar modules and wind turbines, they are sold to developers who plan and construct solar or wind farms.
At the farms, solar modules and wind turbines are linked with electrical components to form a full-fledged system which will be connected to the power grid. Inverters help to convert the system’s power output from DC to AC before delivering them to the grid and consumed by end users.
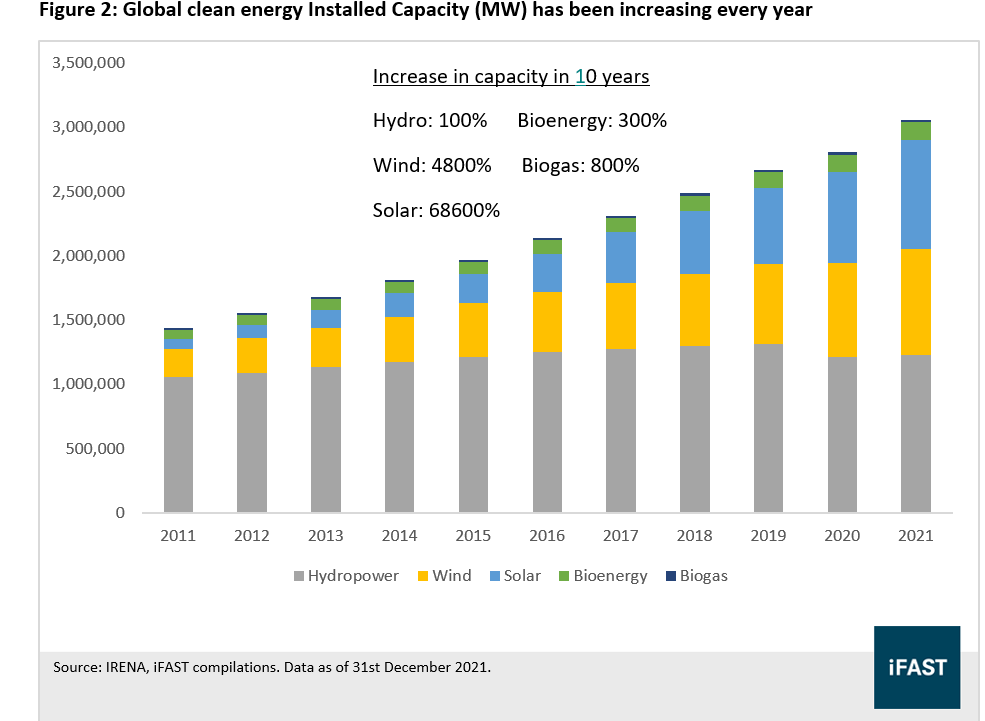
Countries around the world have placed solar and wind in the centre of their energy transition strategy as seen in Figure 2 where wind and solar energy has seen compound annual growth rate (CAGR) of 14.12% and 27.56% in terms of installed capacity over 10 years period respectively.
Meanwhile, hydropower – currently the largest source of clean energy – is likely to face a slowdown in growth (CAGR 1.52% in past 10 years).
Hydropower has been experiencing an increasing cost of installation (more projects are located in challenging sites as the industry matures) and indirect social costs from biodiversity destruction.
Additionally, severe droughts have slashed hydropower generation in the past. Hence, solar and wind are anticipated to overtake hydropower over the long term by becoming the world’s largest sources of clean energy.
Country-wise, China has led the way in endorsing solar and wind power globally, accounting for one-third of total world energy transition investment in 2021 (see Figure 3).
The Chinese government places a priority on investing in renewable energy primarily because it enables the country to tackle problems of air and water pollution while mitigating risks of socio-economic instability.
Reducing air pollution is a direct reason why the Chinese Government promotes renewable energy. It has also started building a 400GW (gigawatt) megaproject in the desert. Half of the installed capacity is expected to be constructed by 2025.
Interestingly, this massive project is more than the entire installed capacity of solar and wind in India.

Takeaway
Overall, we are positive on global clean energy based on the aforementioned reasons. Although we could not rule out the risk of possible slower-than-expected transition towards renewables due to slowdown in the development of solar projects if the supply shortage extends, we think that the global clean energy sector is currently trading at attractive valuations with promising future growth drivers.
In short, the global clean energy sector is undergoing a rapid expansion as it opens up many investment opportunities especially in the cost-competitive solar and wind energy sector.
Both of these sectors will form the backbones of global clean energy evolution moving forward. As clean energy becomes increasingly indispensable, we believe investors should consider allocating to this sector.
Investors do have to take note of curtailment risk which could be caused by the rapid growth of clean energy. Curtailment occurs when not all of the energy generated are consumed by the grid (ie. an oversupply situation).
Low levels of curtailment are still considered normal but an excessively high curtailment rate is unhealthy and could cause governments to halt the development of some clean energy projects.
Regardless, despite a higher curtailment rate of 13.1% year-on-year (yoy) in December 2021, curtailments throughout last year averaged 5.2% less yoy (S&P Global Commodity Insights, 2022). – Aug 4, 2022
iFAST Capital Sdn Bhd provides a comprehensive range of services such as assisting in dealing, investment administration, research support, IT services and backroom functions to financial planners.
The views expressed are solely of the author and do not necessarily reflect those of Focus Malaysia.